Fixing Query Performance at Scale
A production incident where a shared database table could not handle enterprise-scale traffic, fixed by restructuring the table and its indexes with zero downtime — cutting core API response times from 10 seconds to 300ms.
Role
Full-Stack Engineer
Timeline
2025
Outcome
10s → 300ms (97% reduction) on core API endpoints
Status
Production
The problem
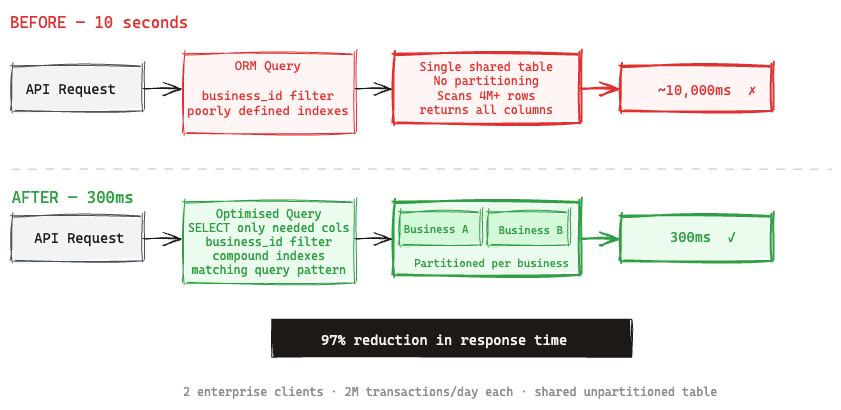
Two enterprise clients, each generating a minimum of 2 million transactions daily, hit a shared database table that was never built for that volume. API calls were timing out. Worse, some small businesses with very little data were seeing no data at all on their dashboards, even though nothing was technically broken on their end.
This surfaced during beta testing, right before a planned stable launch, the moment the affected client came onto the platform. It wasn't a slow-burn issue we had time to plan around; it threatened the go-live date directly. The client flagged it first, then our own monitoring confirmed timeouts were happening across other businesses too.
The stakes were simple: left unresolved, every business on the platform, not just the one that surfaced it, was going to feel it eventually.
Discovery
The first instinct was to suspect the network, since timeouts usually point there first. That turned out to be a dead end.
I moved to isolating whether the problem was in the database query itself or in the application code calling it. That meant stepping through the API locally with a debugger while separately analyzing the raw SQL query's execution plan, to figure out which layer was actually responsible for the slowdown.
The query, run directly against the database, was slow, but not nearly as slow as the same call made through the full API. That gap pointed to the ORM (Prisma, the tool we used to talk to the database) as a real source of added overhead, on top of the query itself being slow.
The more important finding came next: pulling 30 days of data for a small business took roughly the same amount of time as pulling 30 days of data for the client generating millions of transactions daily. That shouldn't happen; a small business's data should return fast almost by default. It was the clearest signal that the table wasn't organized to account for scale at all. There was no partitioning by client, and no indexes built around how the app actually queried the data. Every business, regardless of size, was querying against one large, undifferentiated table.
Total time from escalation to identifying the root cause: about a day.
Constraints
This wasn't an open-ended optimization project. It was a fix against a live production system, under real pressure:
- A hard deadline. The go-live launch was on the line, which ruled out any solution that meant standing up new infrastructure or services and stabilizing them in time.
- The data never stopped flowing. The table wasn't static; new transactions were being written to it continuously, which meant any fix had to account for zero data loss while it was being applied.
- No room for downtime. With well over 2 million records a day landing in this table, simply taking it offline to restructure it risked losing data and breaking the platform mid-launch.
Those constraints shaped the whole approach: fix what was already there, safely, without taking the system down.
The decision
Restructuring the table, not working around it. Options like adding a caching layer or a read replica were considered, but the core issue wasn't just speed. Some businesses were getting incomplete or missing data, not just slow data. That pointed to a structural problem with the table itself, which meant the real fix had to change how the data was organized, not paper over the slowness.
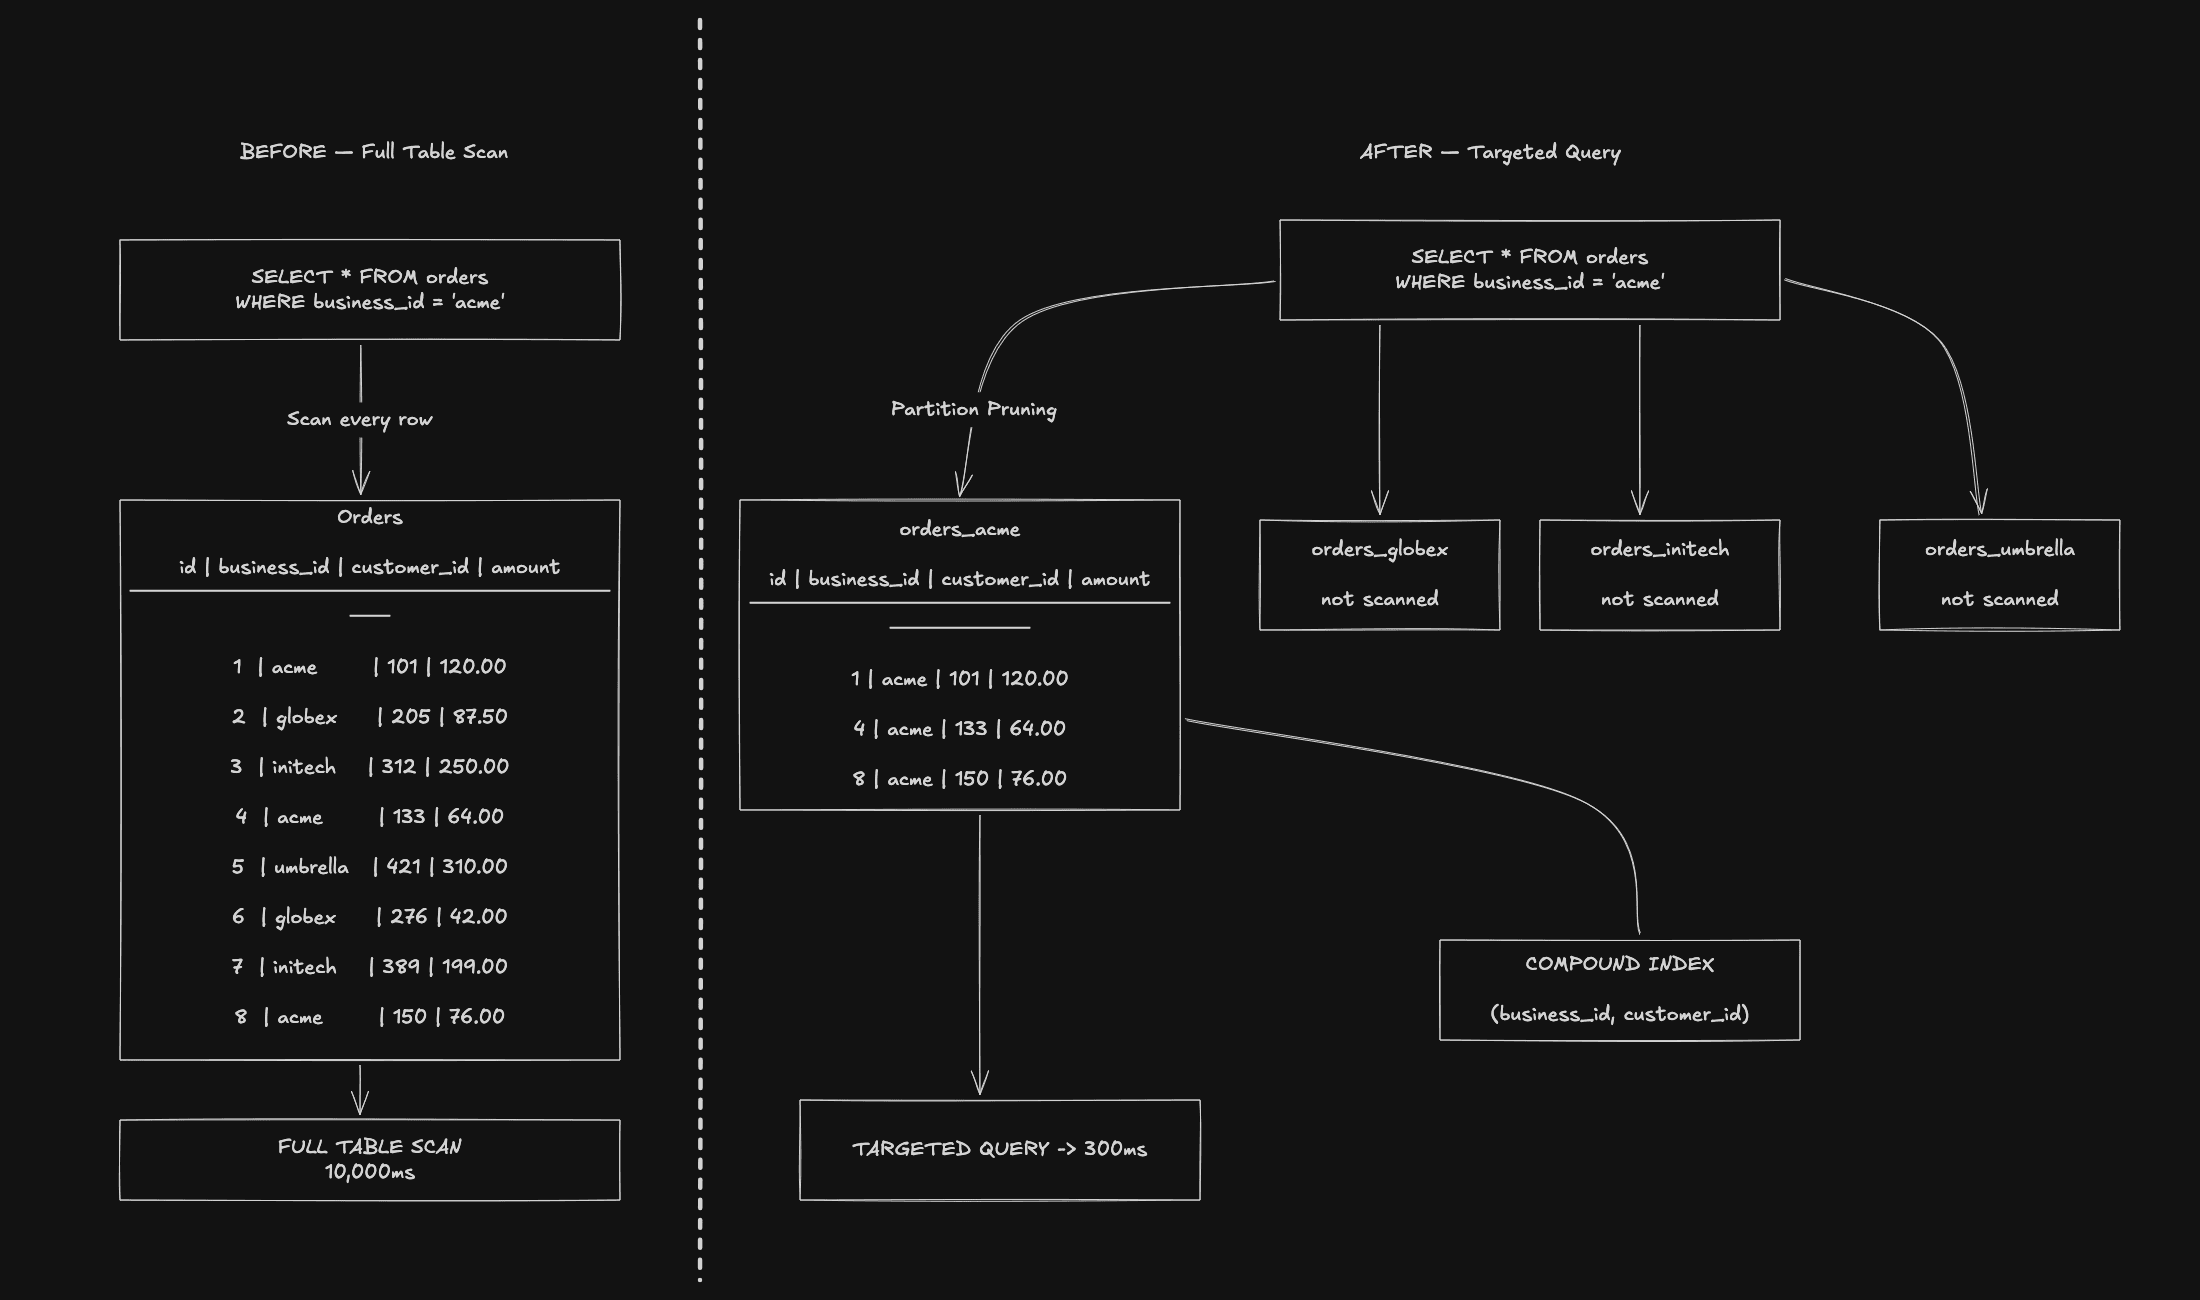
Splitting the table by business, not by date or region. The platform is multi-tenant. One user can own multiple businesses, and almost every query already needed to scope down to a single business. So partitioning the table by business meant each query only had to search within one business's slice of data, rather than scanning through everyone's, which is both faster and far more predictable as the platform grows.
Indexes built around real usage, not just the obvious column. Different parts of the app filtered data differently: some by status, some by date range, some by both. A single, simple index wouldn't have covered those different lookup patterns, so the indexes were built to match how the app actually queried the data, not just in theory.
The first fix wasn't enough on its own. Before restructuring the table, the team first moved the core API calls away from the ORM (Prisma) that was translating our code into database queries, since discovery had shown it was adding real overhead. That closed about 40% of the performance gap, a meaningful improvement, but far from sufficient. It confirmed the deeper problem was how the data itself was organized, not just the tool querying it.
Implementation
- Returning only what's needed: Each API endpoint was updated to pull only the specific pieces of data it actually displayed, instead of returning everything and filtering later.
- Indexes matched to real usage: Every index led with the business identifier, combined with whatever else a given screen actually filtered by, such as status or date range.
- Restructuring with zero downtime: Rather than editing the live table directly, we built new, properly organized versions of each core table alongside the originals, copied all existing data across, then swapped the new tables into place and removed the old ones. The platform kept running the entire time, with no downtime and no missing data.
- Tested before it mattered: The full approach was proven on a staging environment before touching production.
Results
- 10 seconds → 300ms on the core API endpoints: a 97% reduction, measured on a request pulling 30 days of transaction data.
- Held up over time: response times were re-checked periodically over the following 6 months, including against wider date ranges (up to 90 days), to confirm the fix kept working as data volume kept growing.
- Benefited everyone, not just the one client: because the fix changed how the whole table was organized, every business on the platform saw faster queries, not just the one that surfaced the problem.
- Business impact: removed a blocker that could have cost a launch-critical client, and gave the team confidence the platform could support larger, higher-volume clients going forward.
- Follow-on work: the investigation led to a related fix on the frontend, so pages no longer wait on a single slow API call before the rest of the page can load.
Reflection
The clearest lesson: design for your largest possible client from day one, not after one shows up in production. The structural decisions, like how data is indexed and organized, are far cheaper to get right early than to fix retroactively under a launch deadline.
Tech stack
Let’s build something together.
Get in touch →